Rating summary
Anthropic is expected to list in October 2026 at roughly $2 trillion — 31× its end-July run-rate. We ran 100,000 simulated futures through a quarterly engine calibrated to the disclosed record and to 26 comparable listings, and asked one question: what does the buyer at that price actually get, and who is on the other side of the trade?
At $2T the median buyer roughly breaks even over five years, with a 50% chance of losing money and an 18% chance of losing more than half — impairment odds comparable, as an analogy, to a B− credit. The Series G investors who paid $380 billion in February are marked at 4.8× on the same day and keep an A-grade outcome in almost every simulated future. Their exit is the buyer's entry.
Ten predictions about the not-yet-filed S-1 are stated below and hash-committed before the document exists; a five-model LLM panel scores them in public when it lands. The calls precede the evidence, and the record — right or wrong — is permanent.
Analytical opinion, not investment advice. Conflict disclosure, in plain words: I founded Toryx, a company that uses AI models for inference. Anthropic is one of our suppliers, alongside OpenAI, Google, Zhipu, Alibaba and Meta — a supplier among several, not a partner, an investor or a client. I hold no position in Anthropic, and none is available to hold before the listing. One further interest bears directly on an argument I make below. This article contends that economic rents migrate from execution to verification, and I hold filed patent applications in exactly that area — a proof-of-work method for certifying AI output (63/983,531) and a blockchain-anchored verification method (63/984,318), among 15 provisionals filed between mid-2025 and early 2026, one since converted to a non-provisional. If the verification thesis is right, I benefit. Weigh that where I argue it. I am not asking you to take the thesis on my word: to my knowledge, the two working papers cited in support were written by people with no such interest.
Every number below traces to a file in the public evidence repository (appendix). The method was refereed several times before publication by an external model — Qwen3.8-Max, run at temperature zero against a fixed rubric — and then once more by a five-model panel drawn from five independent frontier model families. Every report, including the critical ones and the panel's per-item score matrix, is published alongside this article.
Anthropic is expected to list in October at roughly $2 trillion — 31 times the $65 billion revenue run-rate it reported to investors at the end of July; 22 times the run-rate our model expects it to print at listing. I built a simulation to ask a narrower question than "is it worth it?". The question was: what does a buyer at that price actually get, and who is on the other side of the trade?
What a $65 billion run-rate actually means. A run-rate is simply the most recent period's revenue stretched to a full year — what the company would earn in twelve months at the current pace. Anthropic's is larger than most household names in any industry, which is what makes the growth story real and the price question hard:
| Company | Revenue, most recent full year | As of |
|---|---|---|
| FedEx | $87.9B | FY2025 (ended 31 May 2025) |
| Anthropic (run-rate, not audited) | $65B | end-July 2026 |
| Nike | $46.3B | FY2025 (ended 31 May 2025) |
| Netflix | $45.0B | FY2025 |
| Starbucks | $37.2B | FY2025 (ended 28 Sep 2025) |
| McDonald's | $26.9B | FY2025 |
Anthropic's figure is a run-rate reported to investors, not audited annual revenue — the two are not the same thing, which is part of the argument below.
For scale in the other direction: of the twenty-six large listings this study uses as comparisons, none came public with revenue near this. Measured the same way for each — last-twelve-months revenue at the first report a company filed as a public company (SEC filings) — Snowflake stood at $0.5B, Palantir $1.1B, ARM $2.9B, Alibaba $11.2B, Uber $13.1B. Anthropic would list with roughly five times the revenue of the largest of them — and at a price that still asks a great deal more of it.
The short answer: the median buyer at the IPO breaks even over five years, has a one-in-two chance of losing money and a one-in-six chance of losing more than half — impairment odds I liken, as an analogy, to a B− credit. The investors who paid $380 billion in February are marked at 4.8× on the same day (dilution-adjusted; the raw $2 trillion ÷ $380 billion is 5.3×) and stay A-grade almost whatever happens next — not because they know something the buyer doesn't, but because they paid roughly a fifth of the price. Their exit is the buyer's entry.
How this analysis was built
I love quantitative analysis, and the fundamentals have not changed much since my years inside investment firms. What has changed is the tooling. To my knowledge no publicly available AI will produce the analysis you are about to read on its own — but AI is now a serious lever in the hands of an analyst who knows what to ask of it. For transparency: this work was developed with my own stack of fine-tuned models (Google's Gemma 4 and Qwen3.8-27B) running on two NVIDIA DGX Sparks, a Mac Mini M4 and a MacBook M3 Pro, executing my own code. The configuration that lets the Macs and the DGX boxes work as one machine is my HUMA-D invention (patent application 63/987,731): a software-only memory fabric that stitches CUDA GPUs and Apple Silicon into a single virtual address space over standard Ethernet or Thunderbolt, with speculative prefetching — no custom hardware, no CXL, no ASIC. Fast fine-tuning next to fast inference. A valuation exercise that would once have taken me weeks when I worked at Wall Street firms as a senior quant took me a couple of days.
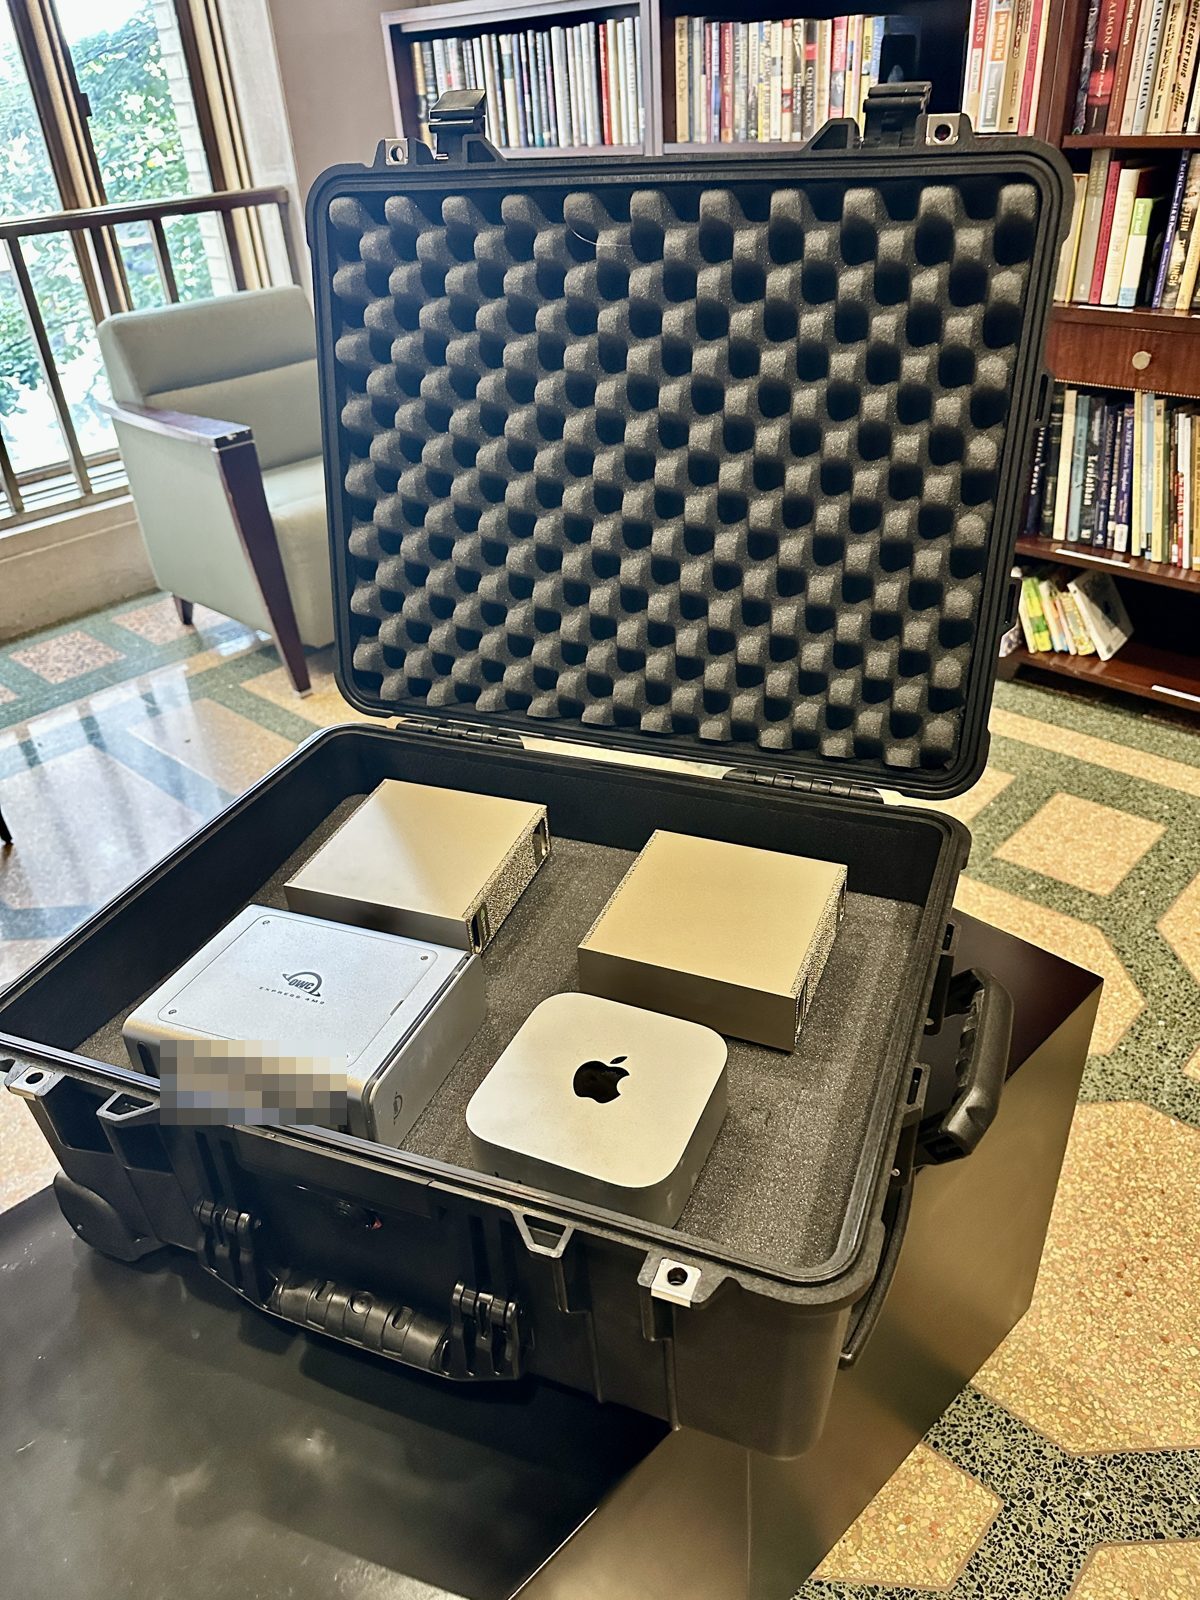
Figure 1 — the same price, seen by two different investors
Two people sit on opposite sides of this listing. The fund is Coatue Management — Philippe Laffont's technology crossover fund, one of the "Tiger cub" firms descended from Julian Robertson's Tiger Management — which co-led the $30 billion Series G of February 2026 alongside Singapore's sovereign investor GIC, at a $380 billion valuation — about 27 times the $14 billion run-rate of the time. The buyer at the IPO is whoever purchases shares on the day the company lists — an institution, a pension fund, or you. The first is selling, or marking up what it already owns; the second is buying. The table below runs the same simulated futures at five possible IPO prices and reports what each of them gets.
Four terms, once, in plain English: IRR is the annual rate of return — the yearly percentage that turns what you paid into what you end with; MOIC ("multiple on invested capital") is how many times your money you get back, so 2× means double; EV (enterprise value) is the price of the whole company; and p25–p75 is the middle half of the simulated outcomes — the range you land in half the time, with a quarter of outcomes worse and a quarter better.
| IPO valuation | EV / model run-rate ($90B) | EV / last print ($65B) | buyer median IRR (p25–p75) | P(lose money) | P(lose > half) | P(≥40% underwater in 2y) | fund MOIC at IPO → hold to 2031 |
|---|---|---|---|---|---|---|---|
| $1.0T | 11× | 15× | 15% (4–28) | 18% | 2.4% | 31% | 2.4× → 4.8× |
| $1.5T | 17× | 23× | 6% (−4–18) | 35% | 8.8% | 43% | 3.6× → 4.8× |
| $2.0T | 22× | 31× | 0% (−10–11) | 50% | 17.7% | 53% | 4.8× → 4.8× |
| $2.5T | 28× | 38× | −4% (−14–7) | 61% | 26.7% | 60% | 6.0× → 4.8× |
| $3.0T | 33× | 46× | −8% (−17–3) | 69% | 35.4% | 66% | 7.1× → 4.8× |
Read it from the right: the fund's mark rises with the price; the odds for the buyer at the IPO fall with it. At every price above $1.5T there is a material probability (9% → 43%) that the buyer at the IPO loses money and the fund makes more than three times its money on the same paths. The grade analogy — P(lose more than half) bracketed by S&P five-year cumulative default rates by notch — reads BBB− at $1T, B+ at $1.5T, B− at $2T, CCC at $2.5T and above. It is an analogy for readability; the probabilities are the rating. Where these letters appear in the charts and tables they are prefixed OR- — OpenRatings grades, this project's own scale, styled after credit notches but defined by the impairment probabilities above, not issued by any credit agency.
What the seller underwrote, against what actually happened
One check matters before any of the above is worth reading: does the engine reproduce the seller's own case? Running Coatue's published base case through it returns an IRR of 36.6% over 19 quarters against the deck's 35% — close enough that the machinery is not quietly disagreeing with the people who priced the last round.
The more interesting thing is what the chart shows next to it. The deck was underwritten from a $14 billion run-rate in December 2025; by May 2026 the company was already printing $47 billion, well above the path the deck assumed. So the bull case does not depend on the current pace continuing. It depends on the deceleration from here being gentle — roughly 40% compound growth from May-2026 levels through 2030. That is the assumption the whole price rests on, and it is the one the S-1 will start to settle.
Figure 2 — what actually moves the answer
What this chart measures. I switched each piece of the model off, one at a time, and re-ran all 100,000 futures. The bar length is how much the company's fair value moves when that piece is removed — how much of the answer each assumption is carrying. Two assumptions matter. Eight barely register.
| What was switched off | What it is, in plain words | Effect on fair value |
|---|---|---|
| Fitted exit multiple → my earlier estimate | The multiple is what a buyer in 2031 pays per dollar of profit. I first set it by judgement; it is now fitted to twelve comparable listings, which produced a lower number. Putting my earlier, more generous estimate back is the single biggest swing in the model. | +$434B (fair value $1.25T → $1.68T; chance of loss at $2T falls 50% → 35%) |
| Gross-to-net revenue restatement | Some revenue is billed through cloud partners. If the accountants judge Anthropic to be the middleman rather than the seller — "agent" rather than "principal" — the same business must be reported at a smaller revenue number. The cash does not change; the reported top line shrinks, and every multiple built on it moves. The model gives this a 35% chance. | +$169B if removed |
| Mark noise | Private valuations are stale and lumpy; this adds realistic jitter to them. | < $6B |
| Gross-margin cliff | A scenario in which the cost of serving customers rises faster than prices. | < $6B |
| Revenue mix | The split between API, enterprise, coding and consumer revenue. | < $6B |
| Lockup shocks | The share-price fall when early investors are first allowed to sell. | < $6B |
| The copula | The mathematical device that makes the model's random inputs move together rather than independently — so growth, margin and multiple sag at the same time, the way they do in a real downturn, instead of politely taking turns. | < $6B |
The same point in one line: almost the whole distance between "coin flip" and "merely mediocre" comes down to one number — the multiple a future buyer will pay — and that number is now measured from twelve real listings instead of asserted by me. The measurement has an error bar about a fifth of its own size; push it one error bar either way and the chance of losing money at a $2 trillion entry runs from 40% to 59%. I publish the number and its error bar together, before the fact, so neither can be quietly adjusted later.
Figure 3 — where the two prices actually sit
Everything above is expressed as odds. This is the same result expressed as a price: what the company is worth, for each rate of return a buyer might demand.
Two lines are drawn across it. $380 billion, the February 2026 private round, sits near the bottom of the distribution at every hurdle rate — on the engine's own numbers that round was cheap, which is exactly why the fund's multiple in the table above is so comfortable. $2 trillion sits above the median at every hurdle. At a 10% required return, 28% of the 100,000 simulated futures produce a fair value above $2 trillion; at a 35% required return, 3% do. The distance between those two lines is the whole argument of this article, and neither of them is a forecast — the curve is.
Why this is a Monte Carlo simulation and not a Monte Carlo Tree Search
A fair question, since my design notes contemplated both (my own "policies": should I buy the IPO price? From my personal trading account? from my IRA? What range should I take?). What runs here is a Monte Carlo simulation: 100,000 possible futures, each played forward quarter by quarter, summarized as a distribution of outcomes. Monte Carlo Tree Search — the technique behind game-playing engines — answers a different question: not "what is the range of outcomes" but "what is the best policy", searching over decisions such as buy at the IPO, wait for the first quarterly print, buy only after a 40% fall, or stay out entirely. That decision layer is specified in the methodology notes for the next engine version and has not been built; no tree-search code exists in this repository today. It would not change the fair-value distribution in this article — the simulator would be the same one — but it would let the next edition publish a recommended policy rather than a price verdict alone. That is the plan for engine v2, stated here so the absence is not mistaken for an omission.
How the engine works — one picture
funding rounds · run-rate prints
26-listing paths · comps table
growth regimes · mix shift · margin
exit multiple (12-comp fit) · shocks
quarterly, 2026Q4 → 2031Q4
seeded, YAML-parameterized
IRR fan · ablation tornado
KMV panel · unwind overlay
P(loss) 50% · fair value $1.25T @10%
The machine the price sits on
The sector Anthropic lists into runs on reciprocal capital. Amazon has committed up to $25 billion to Anthropic; Anthropic has committed more than $100 billion to AWS over ten years. Google invests; Anthropic commits to a million TPUs. Microsoft invests $5 billion; Anthropic commits $30 billion to Azure. Nvidia has agreed to invest up to $100 billion in OpenAI as OpenAI buys Nvidia systems, and in August filed a payment backstop of up to $105 billion for OpenAI's Ohio campus. The hyperscalers' capex was 11% debt-funded in fiscal 2024, 32% in 2025 and 56% in the first half of 2026 (SEC filings; commercial-paper roll inflates the last figure). Meta's Hyperion campus is financed by a $27.3 billion bond at 6.58%, rated A+, in a vehicle Meta does not consolidate.[^spv] CoreWeave, a single neocloud, owes $35.6 billion against its GPUs; its five-year credit-default swap has traded between 450 and 880 basis points this year and its 2031 notes yield 12%. Alphabet raised $84.75 billion of equity-like capital in June.
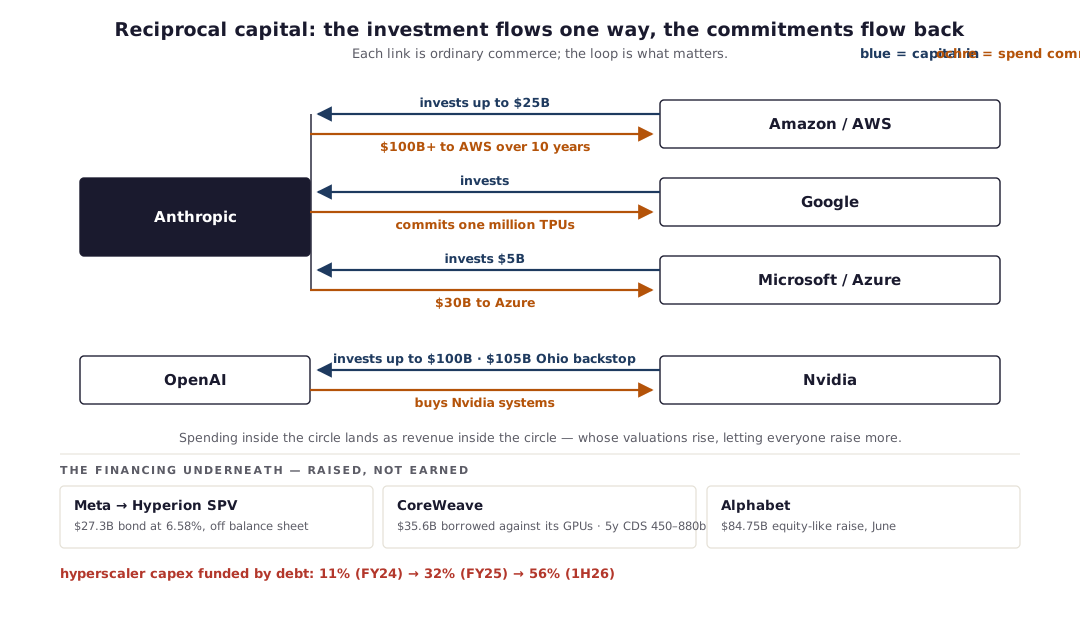
Put plainly: these companies pay for their data centers with money raised against their own valuations, and that spending lands as revenue on the books of the other companies in the circle — whose valuations then rise, letting them raise more. Each link is ordinary commerce. It is the loop that is worth noticing, because it runs in both directions. I do not model how a shock would travel around it, and I do not know at what level it would matter, so I will not tell you that a fall in one company's valuation "is" a funding event for the next. What I will say is this, and only this: The mega-caps in the circle throw off enormous operating cash flow and could fund a smaller buildout out of it; what they are not funding out of it is a buildout of this size — which is why the debt-funded share of their capex went from 11% to 56% in two years.
The labs and the neoclouds have no such cushion at all: CoreWeave's $35.6 billion is borrowed against the GPUs themselves. The dependence is therefore not uniform, and the honest version of the claim is the marginal one — the incremental dollar of this buildout is raised, not earned, and it is raised against valuations. If several of these companies were marked down at once, that marginal dollar would get harder to raise for all of them at the same moment — the same conditions that created the boom would tighten together. That is a structural fragility, documented in the filings, not a prediction. The model treats it as an optional add-on scenario: a 6% chance in any given year that the sector re-prices (about one chance in four over five years), in which valuation multiples are cut in half and demand growth halves for two years. It takes the $2T buyer's median return to −3% a year and the chance of losing more than half to 23%; it takes the fund's hold-to-2031 multiple from 4.8× to 4.2×. The event that puts the buyer under water leaves the fund with four times its money.
The Lehman comparison, stated precisely: the topology is the same as Lucent and Nortel in 2001 — vendor financing in which one party's investment is another's revenue — but Anthropic has no debt, no maturity transformation, no margin calls. It would not have a Lehman Saturday — and I write that as someone who lived through the original and lost a great deal of net worth in it. It would have a Lucent 2001: slower growth, multiple compression, a funding drought, and the discovery that the compute commitments are larger than the revenue can carry. I believe this will be less sudden, not less deep.
Anthropic itself, on the business alone, out-earns every commitment it has disclosed — about $170 billion, perhaps $240 billion — by a wide margin; the issuer is A-grade on its own numbers. So when does that comfortable margin actually break? On the numbers, only in one case: if the company signs compute commitments of the size Dario Amodei has himself described — "if my revenue is not $1 trillion dollars, if it's even $800 billion, there's no force on earth, there's no hedge on earth that could stop me from going bankrupt if I buy that much compute". Sign that, and the company's marked value has roughly a coin-flip chance of falling below what it owes. Short of it, the obligations are covered.
The Pentagon episode
There is a policy chapter the price has to carry, and it closed — for now — the week this version was written. On February 27, 2026, President Trump ordered federal agencies to stop using Anthropic's models and Defense Secretary Pete Hegseth designated the company a "supply chain risk" (TechCrunch, Feb 27; Mayer Brown client alert, Mar 2026). The dispute was contractual red lines: Anthropic would not permit its models to be used for mass surveillance of Americans, and would not power fully autonomous weapons without human oversight of targeting; the Pentagon demanded access for "any lawful purpose." Anthropic sued on March 9 in two federal courts; an appeals court declined to block the designation in April (CNBC, Apr 8); and on August 27–28 Judge Rita Lin ruled the designation unlawful — retaliation for protected speech under the First Amendment, imposed without the process the Fifth requires (CNN, Aug 27; NPR, Aug 28).
Both readings are true, and a buyer should hold them together. The vindication is real: the designation is void, the company held its red lines through a six-month federal blacklisting, and the rule of law priced the dispute. The exposure is also real: a sitting administration demonstrated, twice in one year, that it has the capacity and precedent to restrict this company's operations — the February order and the June export bar (the Department of Commerce, under Secretary Howard Lutnick, barred Fable 5 / Mythos 5 exports on June 12; service was globally disabled for 19 days, until Commerce lifted the controls on June 30 and service returned July 1) — and the courts took six months to unwind the first one.
The run-rate series is the striking part: the meter never blinked. Reported prints ran $14B (February) → $19B → $30B → $47B → $65B (July) straight through the ban and the export episode, because federal revenue is a sliver of a book that is overwhelmingly commercial. That is evidence the demand is not government-dependent — and simultaneously evidence that the revenue base lives at the pleasure of policy environments the company does not control, in Washington and in every export market. And the resilience has a precise texture, which the Ramp mix print already cited gives: the prints kept rising while the dollars sat overwhelmingly on the cheaper model tiers — resilience of adoption, not of revenue-per-token, which is exactly the substitution dynamic priced two sections below.
One more fact belongs beside the vindication, because a hostile reader would raise it. On August 31 — three days after the designation was ruled unlawful — the Department of War announced ChatGPT Mil live on its GenAI.mil platform, accredited to Impact Level 5 and built for a population of more than three million personnel. Say precisely what that is and is not. It is designed capacity, not adoption: the department disclosed no user numbers, no contract value, and describes GenAI.mil as a multi-model ecosystem rather than an exclusive award. It is confined to controlled unclassified work. So the claim is not that a competitor won the Pentagon. The claim is narrower and still uncomfortable for a buyer: while this company spent six months blacklisted, a competitor acquired department-wide distribution, and winning the lawsuit does not return the six months.
The engine already carries a shock process calibrated to the 19-day June export episode. The Pentagon episode belongs to the same family — abrupt, policy-driven, partially reversible — but its measured outcome (six months, then reversal, no visible dent in the prints) argues it is a drawdown-and-headline shock, not a net-demand shock visible in aggregate prints. I leave the shock calibration unchanged and log the episode in the evidence repository; a second designation, or an export episode that outlasts a quarter, is on the trigger list below.
What 26 similar IPOs tell us about the Anthropic IPO
I pulled the daily prices of every large, hyped listing since Facebook — 26 of them, SpaceX included. Twenty-four closed below their first-day close within six months; seventeen traded below the offer price within a year; at week 26 the median listing sat 7% below its first close, the worst tenth 66% below, the best tenth 71% above. The window around the full lockup release was −11% at the median and negative 79% of the time; nine of the 26 lockups lapsed early through earnings or price triggers.
I tried to predict which archetype a listing would follow from what is known before it trades — float, step-up, pricing versus range, the hotness of the year, the VIX — and the classifier does no better than chance — with 26 listings and four archetypes the test has little power, so this is a conservative default, not a proof that the paths are unpredictable. So Anthropic's archetype prior is the base rate: four in ten wobble flat, three in ten slide slowly, two in ten slide straight down, one in ten moonshots. SpaceX, ten weeks in, is tracking the straight slide. What will separate the paths is revealed after listing — which is why this rating is a series, not a verdict.
Fourteen of those listings have a complete eight-quarter tape, and their paths are worth looking at directly rather than as summary statistics.
Twelve of the fourteen — 86% — touched 40% below their IPO price at some point within two years, including names whose eventual outcome was excellent. That is the base rate a buyer at $2 trillion is underwriting against, and it is the reason the model's own 53% probability of a 40% drawdown reads as ordinary rather than alarming. This table is a worker deliverable still pending review; it is shown because the shape of the paths is the point, not the third decimal.
The headwind on my own desk
One more driver deserves a section, because it runs from the published record straight down to my own desk. The price of intelligence is collapsing: Epoch AI measures LLM inference prices falling at rates between 9× and 900× per year depending on the capability milestone — roughly 40× per year to match GPT-4-level performance (Epoch AI, "LLM inference prices have fallen rapidly but unequally across tasks") — and Stanford's 2025 AI Index put the cost of GPT-3.5-level inference down more than 280-fold in under two years (Stanford HAI AI Index Report 2025). The market data in this repository shows where those falling prices send the tokens. On the Ramp panel — the same index that shows business AI adoption climbing from 7.5% to 55.7% of US businesses — Anthropic's own customers put just 6% of their Anthropic tokens on its frontier flagship (11.4% of dollars); the rest rides older, cheaper models (Ramp AI Index, August 12, 2026). And on OpenRouter's public rankings, in our collectors' 2026-08-16 snapshot, 84.4% of captured token volume ran on models priced at or below $1 per million input tokens — while the frontier flagships, priced 10–100× higher, are slivers. A one-day snapshot, precisely labeled as such; the direction is what matters.
This is not a problem I met this summer. Since mid-2025 I have been tracking the other half of the equation — the price of the compute the tokens run on — through my consulting firm, SGX Analytics, which collects GPU marketplace offers daily: spot rental prices by GPU family, the cheapest on-demand price across seven providers, and the model-implied forward curves built from them, plus many other data points and analytics about the GPU marketplace. Two of those series belong in this argument. Spot rental prices fell through early 2026 and then tightened sharply — the capacity cycle the engine carries as shortage/balanced/overbuild regimes. And yet the forward curve sits in backwardation across every GPU family: the market prices compute roughly 20% cheaper twelve months out, at every delivery horizon, for every family tracked.
The bottom of that funnel is my own desk. The hardware under this analysis — two DGX Sparks and a Mac Mini, stitched by my own memory fabric — prices and solves deals with cloud access optional. If setups like the one in the picture above become the norm rather than the exception across family offices, boutique investment banks, hedge funds, defense programs, research labs, and other types of corporate users, that is direct substitution against cloud-metered inference: revenue per user falls even while adoption grows. The engine carries this as a substitution/leakage branch of the capability-plateau scenario — stated as a distribution branch, no cause asserted. And it is pre-committed as a tracked indicator: Part 2 re-prints the cheap-model token share from the same public series, and if it has not risen, this branch loses weight in the engine.
What would change my mind
The S-1. Specifically: the revenue-recognition note (if Anthropic is principal, not agent, on cloud-resold revenue, the restatement branch dies and the chance of loss at $2T falls to 43%); the listing run-rate (below $72 billion, one notch down; above $112 billion, one up); the float (below 5% and the early price tells you nothing); which compute commitments are take-or-pay. After listing: two quarterly prints of metered growth under 30% annualized (the drawdown branch, 75%), gross margin under 35%, a second export-control episode, CoreWeave's CDS through 1,200 basis points or a neocloud missing a payment, two hyperscalers cutting capex guidance in the same quarter. Each is dated and will be scored the week the S-1 is public and again at lockup expiry.
Rated, on the record
This article is the first one rated by OpenRatings — a project built on a simple discipline borrowed from credit markets: put the calls on the record before the evidence arrives, commit to them cryptographically, and score them in public when the evidence lands. The scoring is done by a panel of LLMs; the methodology core is hash-committed in the public evidence repository; the calls resolve as the evidence arrives — an S-1 and a tape, in this case, but the same machinery scores a call on anything that resolves in public. The first four rounds of review used a single external model, and a single referee is a real weakness: one reviewer's blind spots are correlated with its own training data, so the things it cannot see, it cannot see every round. Before publishing, then, I ran the piece past a panel of five, one from each of five independent model families: xAI, DeepSeek, Anthropic, Google and Alibaba. Same frozen text, same ten-item rubric, no cross-talk, temperature zero. Their overall marks were 4.8, 5.5, 5.0, 6.0 and 8.0 out of ten. The 8.0 came from Qwen3.8-Max — the same model that had done the first four review rounds alone — and it is the outlier on every pairwise comparison: the incumbent referee was two to three points more generous than any independent family, which is precisely the failure a panel exists to catch.
| Anthropic claude | DeepSeek deepseek | Google gemini | xAI grok | Alibaba qwen | |
|---|---|---|---|---|---|
| grounding | 6 | 7 | 6 | 4 | 9 |
| engine | 5 | 5 | 5 | 5 | 8 |
| substitution | 5 | 5 | 8 | 3 | 6 |
| pentagon | 7 | 6 | 9 | 8 | 9 |
| scoreability | 6 | 8 | 9 | 9 | 10 |
| calibration | 4 | 5 | 4 | 5 | 7 |
| independence | 6 | 7 | 9 | 6 | 10 |
| overreach | 5 | 4 | 3 | 7 | 8 |
| figures | 4 | 7 | 7 | 7 | 9 |
| clarity | 8 | 8 | 9 | 6 | 9 |
One of the five reviewer LLMs — Google's — found a factual overreach in the reciprocal-capital section that four rounds of the single referee had passed; it is corrected above. Three of the five independently named the same remedy: publish the simulation itself. Declined, deliberately: the engine is the commercial asset of this practice and stays private. What is public is everything needed to hold the rating to account — the data behind every figure, the referee reports in full, the predictions, and a hash of the private methodology file, so Part 2 can prove the method did not move. The panel scored the pre-registered predictions highest (8.4 average) and split hardest — 3 to 8 — on whether the piece stays inside its evidence, which is the honest place for a document like this to be contested.
Two caveats, briefly. The matrix above measures agreement, not error correlation — an article has no gold answer to be jointly wrong about; where our benchmark work does have gold answers, models from three different labs still failed on the same problems (φ ≈ 0.4 on SWE-bench Verified), so a panel's independence is assumed, not proven. And one conflict to name: the Anthropic model was scoring a bearish note on Anthropic's own listing; it was included rather than dropped, and it marked the piece 5.0 — below the panel average.
The grade you have already read — OR-B−, an OpenRatings B-minus, at a $2 trillion entry — is the rating: the impairment probability from the engine, expressed on a scale a credit reader recognizes, refereed externally four times and then panel-reviewed before publication.
And the economics underneath it are no longer just a practitioner's intuition. A working paper by Catalini (MIT), Hui (WashU) and Wu (UCLA) formalizes the argument: as autonomous execution scales faster than verification, the rents migrate from execution to verification and ground truth, and valuations should price a firm's ability to underwrite agentic outcomes ("Some Simple Economics of AGI," arXiv:2602.20946, August 2026). Dr. Noguer i Alonso of NYU derives the same migration formally: automation dates are set by verification cost, not task difficulty, and against an unsound verifier no amount of sampling removes the error floor ("The Economics of Artificial Intelligence: Scaling, Verification, Assignment, Capital, Growth, and Value," AIFI working paper, doi:10.5281/zenodo.22162528, August 29, 2026). Their case for cryptographic provenance as the substrate of that verification is, quietly, the case for the hash committed a few lines below.
The commercial version of that argument is now audible from two directions. Palantir's CEO's, Alex Karp has made refusing the meter part of Palantir's public identity: on CNBC's Squawk Box on July 1, 2026 he relayed what enterprise customers tell him — "I am paying for tokens that create no value" — and offered his own diagnosis that "something has gone completely wrong" with how AI is sold. And OpenAI is reported to be offering some large customers a pay-on-completion price — payment when a task is resolved, rather than per token or per seat (The Information, August 31, 2026; single source, OpenAI declined to comment). The interesting part is not the pricing, it is what the report says stands in the way of it: what exactly counts as success? Stripe's caution, quoted in the same piece, is that a conversion or a cost saving "may also stem from product changes, marketing campaigns or seasonality." That is the verification problem, priced. You cannot sell an outcome you cannot attribute — which is the Catalini and Noguer i Alonso claim arriving as a commercial constraint rather than a theorem. I note both as straws in the wind, not as evidence: one anonymous source with no named customers or figures, one chief executive selling the alternative he praises, and both about companies other than the one being priced here.
before the S-1 is public
calls + private methodology
in the public evidence repo
right · wrong · unresolvable
Brier-scored, quarter by quarter
The predictions — on the record before the S-1
FROZEN 2026-09-03. The wording below is committed and cannot be edited. The SHA-256 of this section and of the full private methodology file are recorded in the public evidence repository, before the S-1 is public; Part 2 reproduces the section verbatim, verifies the hashes, and scores every call.
A pre-registered prediction — a "call," in desk language — is written down before the evidence exists, so it cannot be quietly edited after the fact. Anthropic has not filed an S-1. Nothing below reports what the document says; every prediction states what it will say, written while the document does not yet exist, which is the entire point of the exercise. The hash is what makes it honest: it proves the predictions predate the disclosure, unaltered.
Each prediction is scored right / wrong / unresolvable, and each one names the exact place the answer will be found when the document lands — the line marked Scored against — so there is no room to argue afterwards about where to look. The S-1 predictions are scored against the first publicly filed Form S-1 including its financial statements and notes, the market predictions at final pricing, and the path prediction on the post-listing tape.
The failure states are pre-committed too, so a delayed or cancelled listing cannot be argued into a win. If no S-1 is publicly filed by June 30, 2027, every S-1 prediction resolves unresolvable and is scored as such — not quietly dropped. If the IPO is withdrawn after an S-1 is filed, the document predictions still score against the filed S-1; the pricing and path predictions resolve unresolvable. If a disclosure is ambiguous or simply absent, the prediction resolves unresolvable rather than being argued into a hit. Unresolvable predictions are reported against the track record's coverage, separately from its accuracy — both numbers are published.
- Prediction 1 — the meter, measured. The S-1's revenue disclosure will show usage-priced revenue (API plus usage-billed enterprise) at between 40% and 65% of total revenue — a meter, but not the "80% metered" figure that circulated in secondary coverage, and that my own first draft repeated before the model killed it. Scored against: business description / MD&A.
- Prediction 2 — the floor exists. The S-1 will disclose remaining performance obligations, non-cancelable customer commitments, or equivalent contracted future revenue of at least $15 billion. Scored against: revenue notes / RPO disclosure.
- Prediction 3 — still pre-profit. The S-1 will report a GAAP net loss for both the most recent full fiscal year and the most recent interim period. Scored against: financial statements.
- Prediction 4 — the margin band. Gross margin, as disclosed or derivable (revenue less cost of revenue), will fall between 35% and 55% for the most recent period, as reported in GAAP financials, excluding non-GAAP adjustments. Scored against: income statement.
- Prediction 5 — the commitments. Total disclosed compute and purchase commitments will sum to between $120 billion and $300 billion. Scored against: commitments and contingencies note.
- Prediction 6 — the listing run-rate. The most recent quarter disclosed in the S-1, annualized by simple multiplication of the most recent quarter × 4, will land between $72 billion and $112 billion — the engine's one-notch band around its $90 billion listing estimate. Scored against: financial statements.
- Prediction 7 — the company names the risk. At least one of the first ten risk factors will be dedicated to compute purchase commitments, data-centre capacity, or infrastructure obligations — scored on that risk factor's own heading and subject matter, not on an exact phrase, so a differently worded heading plainly about the same obligation counts and a passing mention buried inside an unrelated risk does not. Scored against: the first ten risk-factor headings.
- Prediction 8 — the pricing bracket. The IPO will price at a fully diluted market capitalization (offer price × fully diluted shares per the prospectus cover) between $1.2 trillion and $2.2 trillion — clear of the $965 billion Series H mark by a real margin, and below the euphoria case. Equivalently, between roughly 13× and 24× the S-1's annualized most recent quarter. If the two tests disagree, because the disclosed run-rate lands outside the $72–112 billion band of Prediction 6, the dollar bracket governs. Scored against: final pricing, prospectus cover.
- Prediction 9 — the gross-or-net question. The S-1's revenue-recognition note will state whether the company acts as principal or agent on cloud-resold or partner-distributed revenue — the disclosure that resolves the $169 billion restatement branch in Figure 2. Scored against: revenue-recognition note.
- Prediction 10 — the path base rate. Within 26 weeks of listing, the shares will trade below their first-day closing price at least once — 24 of the 26 comparable listings did. Scored against: post-listing daily prices.
These ten calls are hash-committed now and scored in public in Part 2 — against the filed S-1, by a five-model panel, right or wrong. If you want the scorecard when it publishes, ask and you will get it.
Email me when Part 2 publishesGoes to the analyst directly. No list, no tracking pixel in the mail, no forwarding — and nothing else is ever sent.
The meter is what makes the business impressive, and it is also what makes the price fragile — the same revenue that compounds on the way up is the revenue that can be dialled down, per call, by every customer at once. Nothing here says the business fails. The risk sits entirely in the price: it assumes a multiple the public market has never paid for a decelerating consumption business, and it is being offered to you by people who paid roughly a fifth of it.
[^spv]: Is that an off-balance-sheet vehicle, like 2008? Partly, and the differences matter. Meta's Hyperion data centre is financed through a separate company that issues its own bonds; Meta does not consolidate it, so the debt does not appear on Meta's balance sheet. The structural resemblance to the pre-2008 vehicles is real — an asset financed off the sponsor's books. Three things are different. The bonds are backed by a physical data centre with a long-term tenant, not by pools of mortgages whose quality nobody could inspect; there is no maturity mismatch, meaning the vehicle is not funding a twenty-year asset with thirty-day paper, which is what actually broke in 2008; and the paper is rated A+ and was sold to institutions that can hold it to maturity. What it shares with that era is optics and incentive: financing that keeps leverage out of the headline numbers, which makes the sector's true borrowing harder for an outsider to total up. That is a transparency problem, not yet a solvency one.
Appendix — what the engine does, and what it does not do yet
What is released, stated plainly: the public evidence repository carries the artifacts — the data behind every figure, the referee reports in full, the pre-registered calls and their hashes. The engine — code, calibrations, prompts, weights — is private; it is the commercial asset of this practice, and its methodology file is hash-committed in the public repository so that the method can be verified not to have moved between this edition and Part 2. The table below lists the techniques that produced numbers in this article; the decision-layer section after it names what is specified for engine v2 but not yet built, so an absence is not mistaken for an omission.
| technique | what it does in this article |
|---|---|
| Monte Carlo simulation | every number here — the distribution of outcomes |
| Bayesian shrinkage on the exit multiple | the 12-comp fitted multiple and its bootstrap error bar — the single largest channel in Figure 2 |
| Substitution / leakage | the cheap-model branch; a price–quality gap moving revenue to open-weight or local compute |
| Capacity-cycle regimes (3-state Markov) | shortage / balanced / overbuild with dwell times, driving the compute-price index |
| Regulatory hazard from one observation | the Gamma–Poisson posterior fitted to the single 19-day June export episode |
| Tail dependence (t-copula) | drivers sag together in the left tail instead of independently; a Gaussian copula alone understates it |
| IPO-desk items (lockup, float, adverse selection) | the lockup supply shock and float-scaled mark noise |
Specified for engine v2 and not built — no number in this article comes from them: Longstaff–Schwartz regression, backward induction on a grid, Monte Carlo tree search and a POMDP with a particle filter (together, the decision layer described below), and opinion pools for aggregating analyst seats.
The state and the drivers
Per path, per quarter t, the engine carries revenue by bucket (API-direct, API-cloud, enterprise, Claude Code, consumer), committed backlog, gross margin, a compute-price index, frontier and open-tier token-price indices, external demand, the capacity regime, a per-bucket quality gap, a shock flag, the multiple, the price, and the lockup flag.
The drivers, written out. These are sketches of the update rules, not the implementation; the implementation and its parameters live in the private engine, under the methodology hash.
| driver | update rule |
|---|---|
| external demand | log Dt = log Dt−1 + μscenario + σD·zD scenario ∈ {bull, base, bear} |
| capacity regime | st ~ Markov chain, minimum dwell 2 quarters CPIt = CPIt−1·exp(κ(st) + σc·zc) |
| bucket revenue | Rt = Rt−1·(1 + gt)·(1 − leakt)·(1 − shockt) gt = g∞ + (g0 − g∞)·e−t/τ τ = 4–6 quarters; enterprise revenue is floored at a fraction of committed backlog |
| substitution | leakt = base + (cap − base)·sigmoid(kp·log(pricefrontier / pricealt) − kg·quality gapt) leakage rises with the price gap, falls with the quality gap |
| token price | log TPt = log TPt−1 + δ(st) − η·leakt + σp·zp |
| gross margin | GMt = 1 − costt cost glides 0.71 → 0.56; compute-price pass-through applies only to the spot share |
| policy shocks | hazard ~ Γ(2, 12) [posterior] revenue haircut, persistence, multiple haircut |
| exit multiple | log Mt = Xt·βshrunk + φ·εt−1 + σε·zm plus a hard branch: compression to 15× |
| price | Pt = P0·(Vt / V0)·(1 − lockup shockt) with float-scaled mark noise |
| correlation | (zD, zc, zp, zm, shock latent) ~ t-copula, ν ≈ 4 |
Two of those lines carry most of the argument. Substitution is why adoption can rise while revenue per user falls: leakage is driven by the ratio of frontier price to the cheap alternative, damped by how much better the frontier model actually is. Correlation is why the left tail is fatter than it looks: under a t-copula the drivers sag together, so the bad quarter for growth is also the bad quarter for the multiple.
The decision layer, once it exists
The engine answers what is the range of outcomes. It does not answer what should I do, and the difference is a different piece of machinery: a policy tree over the same simulated futures, in which the buyer chooses at each quarter between buying at the offer, waiting for the first print, waiting for the lockup, buying only after a 40% fall, and staying out — while the fund chooses when to sell.
Its output would be a value and IRR distribution per policy, and a policy map — the next edition's contribution. It is stated here so its absence is not mistaken for an omission, and so that no reader takes anything above as advice about when to buy.
Appendix — traceability
Every claim maps to an artifact. Figures, register and prediction files are published in the public evidence repository; paths under sim/ and data/ refer to the private engine, whose contents are covered by the committed methodology hash rather than released.
| claim | artifact |
|---|---|
| Ladder, fair value by hurdle, KMV panel | figures/price_ladder.md, figures/fair_value_by_hurdle.md, sim/out/valuation.json |
| What moves the verdict | figures/tornado_v15.png, figures/ablation_v15.md, figures/multiple_fit_loo.md |
| Sector-unwind overlay | figures/price_ladder_unwind.md, sim/config/unwind.yaml |
| Run-rate series, commitments | data/run_rate_series.csv, data/research/H/H7_7_*.csv, H7_6_*.csv |
| Circular capital: capex/debt, Hyperion, CoreWeave, Alphabet | data/research/H/H7_3_*.csv, H7_4_*.csv, H7_2_*.csv, H7_5_*.csv, H7_13_*.csv |
| 26 listings: paths, lockups, macro | data/research/H/H1_paths_from_bars.csv, H1_lockup_*.csv, H2_macro_at_ipo.csv, figures/archetypes_26.md |
| Default-rate brackets | docs/review_2026-08-21/04_sp_default_rates_verified.md |
| Pentagon episode timeline + chart | figures/runrate_policy_timeline.png, data/run_rate_series.csv |
| Two-investor comparison, IRR fan to 2028Q4 | figures/two_investor_crossing.png, figures/irr_fan_to_2028Q4.png, sim/out/valuation.json, sim/out/base/summary.json |
| Reciprocal-capital circle | figures/reciprocal_capital_circle.png, data/research/H/H7_*.csv |
| Run-rate magnitude table | company results releases / SEC filings; comps from data/comps_fundamentals.csv |
| Substitution evidence (Ramp + OpenRouter snapshot) | figures/substitution_series.png, data/research/H/H7_12_ramp_ai.csv, data/sgx/model_usage.csv, data/sgx/model_pricing.csv |
| Pre-registered calls v4 (SHA-256 committed) | article/the-meter-is-the-trap-v4.md §Rated, on the record |
| Referee reports (rounds H1–H6, single model) | docs/review_2026-08-21/*_qwen38max.md, docs/review_2026-08-29/H5_v4_qwen38max.md |
| Referee panel (5 families) — per-reviewer verdicts, agreement matrix, producing script | docs/panel_2026-09-01/P1_*.md, docs/panel_2026-09-01/P1_matrix.json, scripts/referee_panel.py |
| Model error-correlation matrix (the φ = 0.41–0.46 figure) | data/swebench_error_correlation_2026-04-22.md (evidence repository) |
| Corrections | docs/review_2026-08-21/H_triage.md §3, §7 |
Corrections made during review. These are errors in earlier drafts of this article — you have not seen them above, because the referee rounds caught them and they were fixed before publication. They are recorded here deliberately: a rating whose mistakes vanish silently is not one you should trust. An early draft cited Lucent's FY2001 vendor-financing provision as $3.7 billion (it was $2.2 billion); read Odlyzko's fibre figures as the share of fibre lit (they are link utilisations); misstated the Loughran–Ritter result (it is that IPO issuers returned 5% a year over five years, and an investor needed 44% more capital in them to match non-issuers); and quoted secondary revenue estimates for several comps ($1.6B Snowflake, $19.0B Alibaba) where this edition computes them uniformly from each company's first post-IPO SEC filing ($0.5B, $11.2B).
Analytical opinion, not investment advice.